

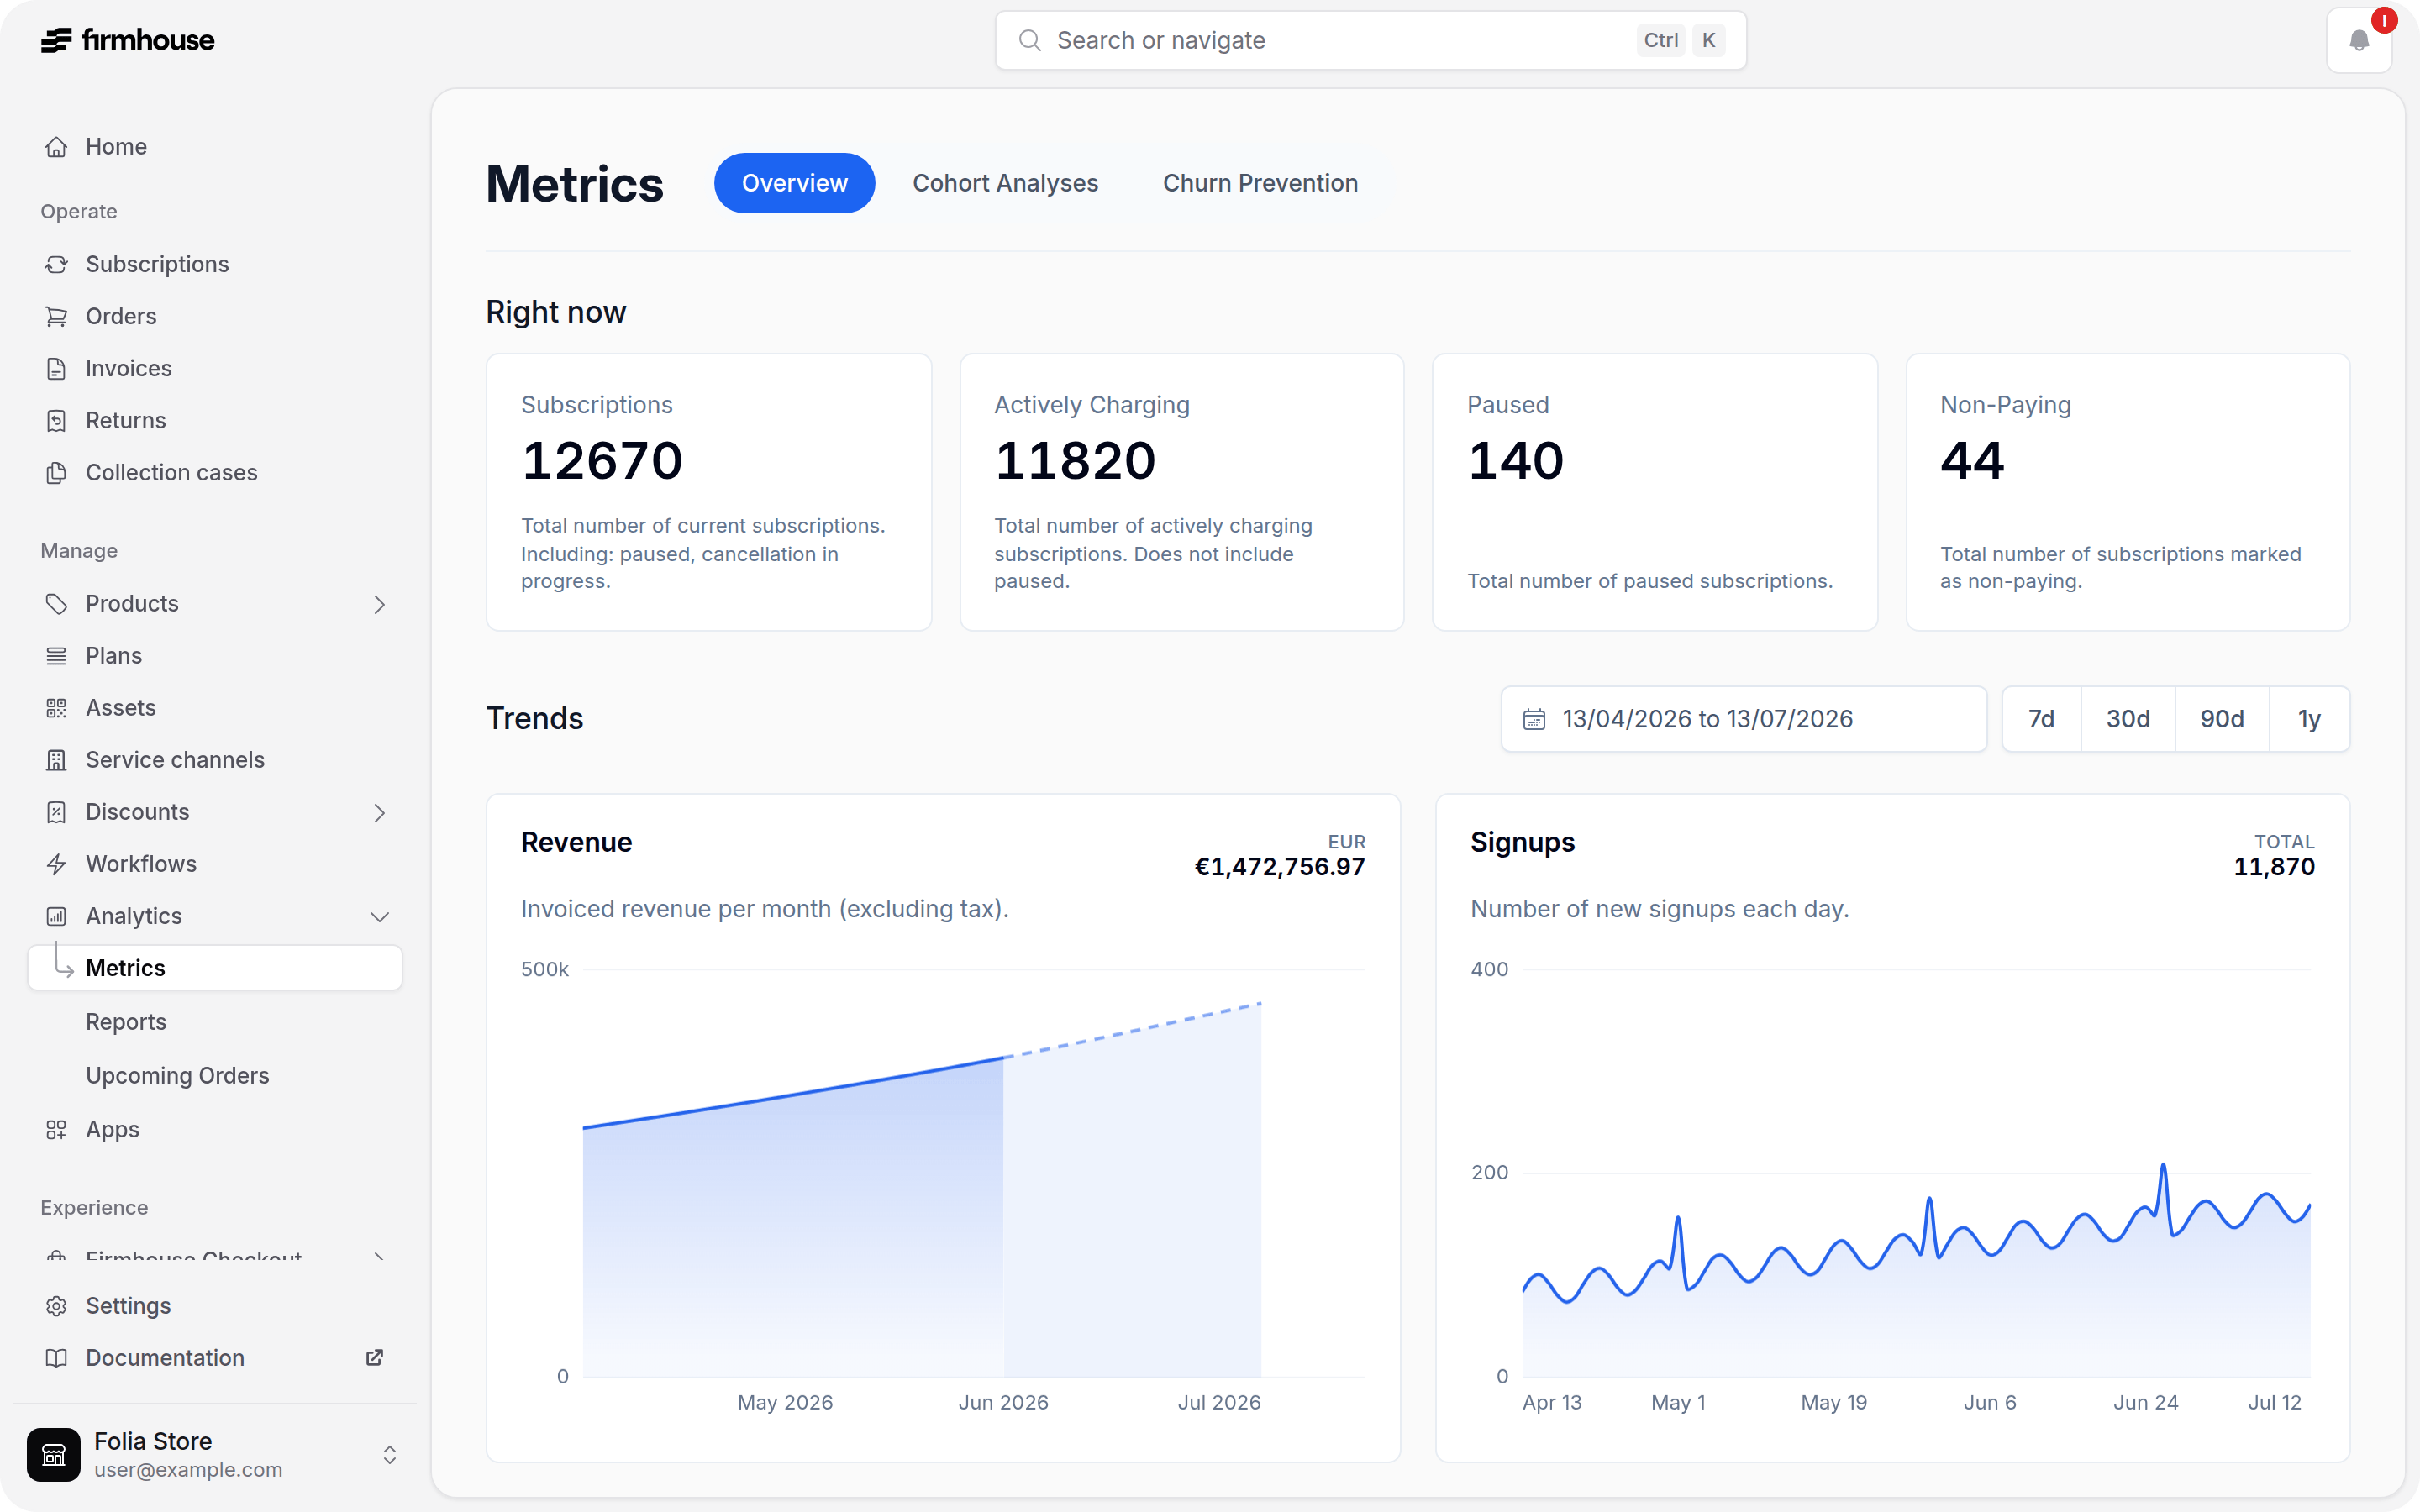
Sections on the dashboard
You’ll find separate sections for overview metrics, cohort analyses, Lifetime Value, and churn prevention. All Time shows important KPIs relevant for your business for the full history of your business on Firmhouse. Right Now shows how your business is doing right now in a birds-eye overview. Cohort Analyses contains multiple cohort analyses and heat-maps, so you can see how your business is performing over time. This helps you understand what impact marketing campaigns, price changes, seasonality, or product changes may have. Lifetime Value compares revenue, average lifetime value, and weighted lifetime value for monthly signup cohorts.Section: All time
Count of all Historic Checkouts is the number of all Checkouts that have been performed and recorded into Firmhouse since your business was on Firmhouse. This may also include imported data from before your time on Firmhouse. The number is the sum of all subscriptions and one-time purchases (if made through Firmhouse Checkout). Count of all historic One-time purchases shows the count of all one-time Checkouts if you have the one-time purchase feature enabled in Firmhouse. These are Checkouts that do not include a subscription product. Total Revenue is the sum of all invoiced revenue that is recorded as an Invoice in Firmhouse. This includes regular invoices and credit notes.Section: Right now
Count of Subscriptions is the count of all current active subscriptions, including paused but excluding cancelled subscriptions. This will also include “cancellation in progress” subscriptions because technically these customers are still billed until they are fully cancelled. Count of Actively charging is the count of all actively charging subscriptions. This means they have an active subscription and active products in them and they are not paused. Count of Paused is the count of all currently Paused subscriptions. Count of Non-Paying is the count of subscriptions that currently have a problem with their payment method, or that failed to pay for an order or invoice even after various automatic retry attempts.Estimated monthly recurring revenue (MRR)
Estimated MRR shows the current recurring charges excluding tax from actively charging subscriptions, normalized to an average month. For example, a recurring charge billed every three months contributes one third of its charge amount to MRR. Amounts are shown separately for each currency. Firmhouse roughly calculates this by converting every current plan and recurring product charge to a monthly equivalent, then adding those amounts together. A €10 weekly charge contributes about €43.50, a €90 charge every three months contributes €30, and a €120 yearly charge contributes €10. Product quantities are included in the recurring charge before it is converted. The estimate excludes paused subscriptions, one-time products, and shipping. It uses current subscription and recurring product prices, so discounts applied later and future price or subscription changes are not included. Because Firmhouse creates invoices when payments are due, Estimated MRR will not exactly match invoiced revenue for a month.Churn rate
Churn rate shows cancellations from the last 30 days as a percentage of actively charging subscriptions. Each point in the churn rate graph uses a rolling 30-day window: it includes cancellations from that day and the previous 29 days, divided by the actively charging subscriptions on that day. This means the churn rate can still be above 0% on a day with no new cancellations. Earlier cancellations continue to count until they fall outside the 30-day window. The percentage can also change when the number of actively charging subscriptions changes, even if there are no new cancellations that day.Chargeback rate
Chargeback rate shows the rolling 30-day share of completed payments that are currently charged back. Completed payments include payments that are paid, paid out, refunded, partially refunded, or charged back. Open, pending, failed, cancelled, and expired payment attempts do not count toward the rate. Each payment is grouped by the date it was created. This means a later chargeback changes the historical rate for the period in which the original payment was created. Use the graph to compare payment cohorts over time. For reconciliation through the GraphQL API, query an invoice’schargedBackAt for the most recent chargeback transition and paidAt for its earlier paid timestamp. Check your payment service provider when you need the chargeback reason.
Section: Cohort analyses
All cohort analyses and heat-maps are currently based off a monthly cohort. Support for other dimensions and filtering will be added in the future. Use the year buttons above an analysis to view any year since your Firmhouse project was created. Each year is loaded separately, so selecting an older year does not slow down the initial dashboard view.How to read the cohort analyses and heatmaps
Vertically in the cohort table you see the months in the selected year, and for each month the total number of subscriptions signed up in that month. Horizontally the table shows the value and percentage of how many subscriptions of the given cohort match the criteria that the cohort analyses is about.Orders placed over time
This cohort analyses shows you how many subscriptions of each cohort continued to place orders every month. This is very similar to a typical Retention analyses, but this cohort analyses only takes subscriptions into account when they have actually placed at least one order in the given month after signup. This analyses is useful to see if your customers keep ordering your products over time.Orders at cancellation
This cohort analyses shows you how many orders customers have placed before they decided to cancel. The analyses only includes cancelled customers. The higher the number, the better as the Customer Lifetime Value increases the more orders a customer has placed.Section: Lifetime Value
The Lifetime Value cohort table initially shows the most recent 12 monthly cohorts. Select Show all cohorts to reveal the history back to the month your Firmhouse project was created. Older rows load as you scroll so the initial page remains responsive.Section: Churn Prevention
Open Analytics → Metrics → Churn Prevention to review customer feedback for your selected period. The Subscribed product(s) column shows product names, total quantities, Firmhouse product IDs, and SKUs when available. For example,2x TEA-01: Green tea (#1234) means two units of product #1234, with SKU TEA-01.
Cancellations prevented counts cancellation-flow churn requests created in the selected period and finalized as prevented. Total cancellation attempts counts requests from that period finalized as either prevented or completed; requests still in progress are excluded. The prevention rate is prevented requests divided by finalized requests. Custom funnel events in GA4 or VWO are not counted unless the custom flow records the save in Firmhouse.
Long lists are shortened in the table. Select View all products, or click the feedback row, to open the full product list and feedback.
The SKU prefix follows your project’s setting for showing SKUs with product titles. When disabled, you see 2x Green tea (#1234) instead.
These are the subscription’s active products and quantities today, excluding owned and returned products. They may differ from when the customer shared the feedback. A dash means the subscription has no active products to show.
Select Export to CSV to open the feedback report, where you can export the full product details for further analysis.